
Regulations
CBAM Default Values in the Definitive Period: Which Value Applies, and How?
How do CBAM default values work in the definitive period? IR (EU) 2025/2621, the 2026/1740 correction, mark-up rates and the '–' rows — a verifier's guide for exporters and importers.

İpek Göktaş Kalkan
10 August 2026 · 8 min read
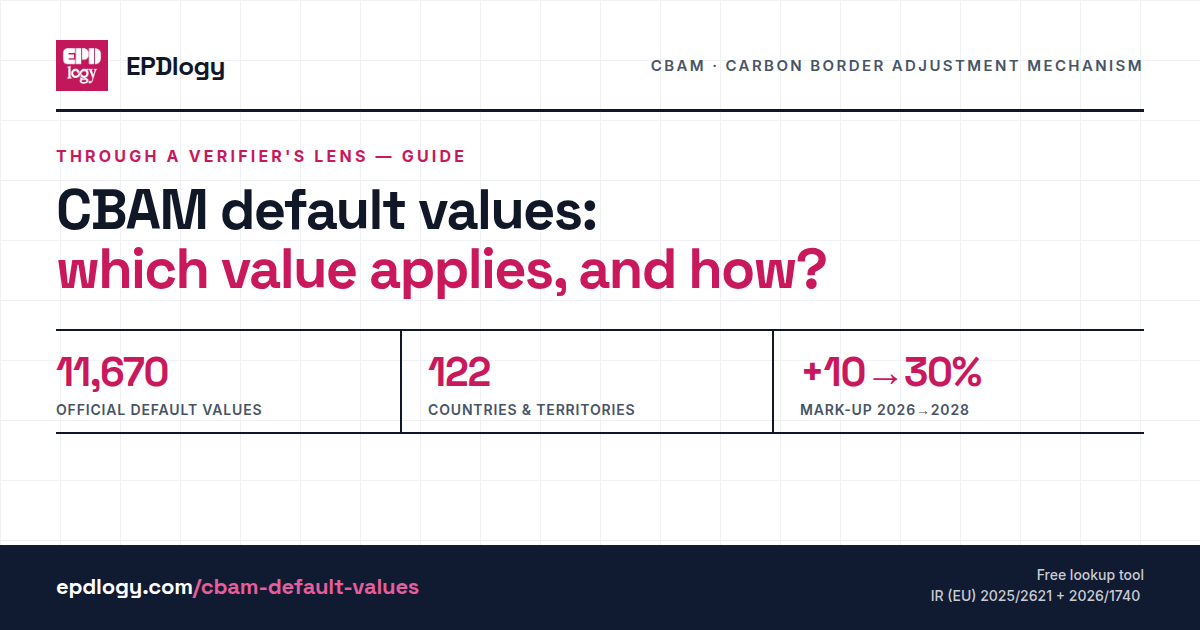
Since 1 January 2026, CBAM has been in its definitive period: companies importing cement, iron and steel, aluminium, fertilisers and hydrogen into the EU must surrender certificates for the embedded emissions of their goods. Which puts one question in front of every importer — and every manufacturer selling into the EU: which number goes into the emissions calculation?
There are two options. Either you use your installation’s actual, monitored and verified emissions data, or you use the default value the European Commission has set on your behalf. This article explains the rules of the second option — because until you know how default values work, you cannot calculate what building your own data would actually save you.
Before writing this, we worked through the relevant annex line by line: a 1,913-page Official Journal annex containing more than 11,000 values across 122 countries and territories. You will find the output of that work at the end of this article.
The legal framework: two regulations, one set of tables
The definitive-period default values were established by Implementing Regulation (EU) 2025/2621 of 16 December 2025, applicable from 1 January 2026. The story did not end there: a series of transcription errors occurred when the tables were consolidated at speed, and on 31 July 2026 the Commission replaced Annex I (and Annex IV) in their entirety through Implementing Regulation (EU) 2026/1740. The correction applies retroactively from 1 January 2026.
The practical consequence: the values in force today are the tables annexed to 2026/1740. If you are working from the tables published in December 2025, you may be using outdated numbers — particularly for certain steel codes and the cement TARIC splits.
How to read the tables
Annex I is organised as one table per country. Products are listed by CN code (for some cement products, by 10-digit TARIC code), with three values each: direct emissions, indirect emissions and total emissions (tCO₂e/tonne of good).
Here is a detail worth underlining through a verifier’s lens: according to the regulation’s recitals, the certificate calculation is based on the total emissions column; the direct and indirect columns are provided for information. You do not need to sum direct and indirect and worry about rounding differences — the operative number is the total.
You will also see letters (A) to (L) on some rows. These indicate the production route determining the CBAM benchmark used in the free-allocation adjustment: for example, (C) is carbon steel via BF/BOF, (K) is primary aluminium, (A) is grey clinker/cement. Where no route is indicated, the benchmark is independent of the production route.
One scope note: electricity is not in these tables — the Annex I heading explicitly says “except for electricity”. Default values for electricity follow separate rules.
The mark-up: from 10% to 30%
Using a default value has a price. The regulation adds a mark-up on top of the total emissions calculated with a default value:
For cement, iron and steel, aluminium and hydrogen, the mark-up is 10% for 2026, 20% for 2027 and 30% from 2028 onwards. For fertilisers, it is 1% for every year.
The logic is straightforward: default values are meant as a convenience, not a permanent strategy. By 2028, an importer without actual data will be declaring thirty percent more emissions than a competitor working with verified installation data for the same product — with certificate costs to match.
Rows marked “–” and countries not listed
Browsing the tables, you will see many cells marked “–”. The regulation addresses this explicitly: where a country is listed but no value is provided, or the field shows “–”, the value from the “Other countries and territories” table applies. The same rule covers countries that do not appear in the tables at all.
This detail matters more than it looks, because the “Other countries” values are higher than the country-specific values for most products. A “–” in your country’s row does not mean there is no value for that product — it usually means a higher fallback value applies instead.
What did the correction actually change?
The corrections listed in the recitals of 2026/1740 read like a small case study in why these tables deserve careful reading. A few examples: white and grey clinker, and white and grey hydraulic cement, are now separated into distinct rows with 10-digit TARIC codes; the calcined clay row moved to a TARIC code because the CBAM scope was narrowed to calcined kaolinic clay; erroneous values for Taiwan’s stainless steel codes (7218–7223) and a transcription error in Angola’s iron ore row were corrected; and values inadvertently omitted for seven countries, from Albania to Zimbabwe, were added. The regulation also deleted the 2026/2027/2028 “including mark-up” columns entirely, to avoid rounding inconsistencies — the final calculation now happens inside the CBAM Registry.
Each of these looks small on its own. But a single value taken from the wrong version, multiplied by an annual import volume, becomes a serious deviation.
The real message for exporters
Default values are a safety net that makes the importer’s life easier — at the cost of declaring, in most cases, higher emissions than reality, plus a mark-up on top. On the other side of that equation sits actual installation data, monitored and verified under the CBAM rules: use it, and the mark-up never applies.
If you manufacture outside the EU and sell into it, the first step is simple: look up the default value for your product’s CN code in your country’s table, and compare it with your own estimated emission intensity. The gap between the two is the return on investing in your data infrastructure. That work needs to start now — and as with the Digital Product Passport and EPDs, the same production data underpins more than one regulation.
Stop searching the tables by hand: the lookup tool
The output of the line-by-line work I mentioned at the start is our free CBAM Default Values Tool. You can filter every value in the official tables by country, sector, product name and CN/TARIC code; see automatically which fallback value applies to rows marked “–”; and, if you hold verified data of your own, calculate your annual certificate cost difference against the default-plus-mark-up scenario. The tool is for information only; the binding values are always the regulations published in the Official Journal. You can also download the Commission’s consolidated Excel file and the ten guidance documents from our CBAM Guidance Documents page.
At EPDlogy we help manufacturers build product-level emissions data: collecting production data, calculating emission intensity per product and preparing the file so it is ready for CBAM verification. The verification itself is the job of accredited verifiers; our contribution is making sure you arrive at that table with a solid file. If you would like to discuss where to start for your products, get in touch.